Saturday, February 7, 2009

Tracking Regional Visits to your Etsy Shop by Time of Day

Google Analytics will show you your page visits according to the local time you have set in your profile. The World Wide Web being, well, worldwide however means that if you want to see the local time of your visitors - the time at their location when they are looking at your site - you have to move the data around a little. You can get a good idea by using the Custom Reports in Google to group your visits by both region and hour of day to see where your visits during a certain hour are coming from and what time visits from a certain region are coming in. Here's how:

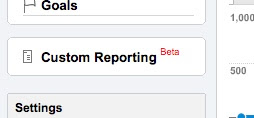
From the left side bar, click the Custom Reporting link.


Click on Create New Custom Report


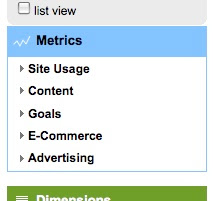
In the blue Metrics box on the left, open the Site Usage link


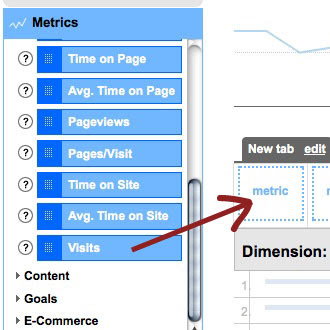
Scroll down and select the Visits block. Drag it to the first empty Metrics box in the report tab

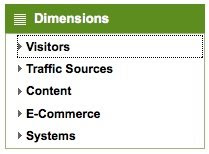
From the green Dimensions box below the Metrics box on the left, select the Visitors link and drag the green Region block to the empty green Dimension box below the Metrics box.

Next, drag the Hour of Day block to the first empty Sub Dimension box. When you're done, it should look like this:
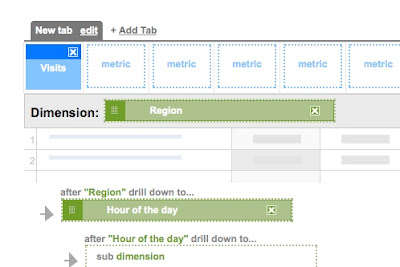

Give the report a title at the top of the page and then click Create Report at the bottom.

You will now find this report under your Custom Reports link in the left-side menu. Bring up the report and you will see a list of regions with the number of visits from each one:


Click on one of the regions and a list of the hours of the visits will come up, ranked by how many visits in each one.


These are listed by your local time - the time you have set in your profile. To find out the visitor's local time, use a time zone converter.

You can also switch the dimension and subdimension in your custom report to create another report to break down your hourly visits by region. Follow the steps above and make your custom report look like this:
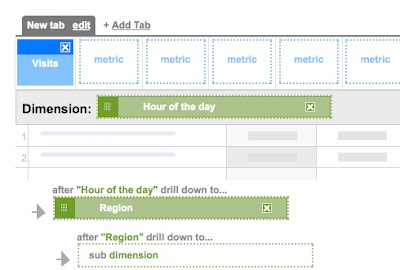

This report will let you look at your traffic broken down by hour of day first, then further group the data by region.

Thursday, February 5, 2009

Tracking the Depth of Visit to your Etsy Shop

Google Analytice can tell you how many people are clicking past the first page of your listings by looking at the page numbers that Etsy includes in the URL of your shop pages. If you go to page 2 or above of your shop, you can see these numbers in the address:

www.etsy.com/shop.php?user_id=xxxxxxx&order=&section_id=&page=2

You can sort your content report in Google Analytics by these different page URLs to see how many people are clicking past your front page. Here's how:

  • From your Google Analytics dashboard, click the Content link in the left-hand menu.
  • Click Content by Title
  • From the report, find the title of your Shop page. Because Google ranks the report by how many pageviews it has had, your shop page is usually at or near the top of the report. Click on the shop page.
A list of partial URL's will appear. Your first shop page will usually be at the top, and will look like /shop.php?user_id=xxxxxxx. This is page one of your shop. You can see in the columns to the right the number of visits you had to this page.

Hover your cursor over the next partial URL on the report. It will probably be page 2 of your shop, and will look something like www.etsy.com/shop.php?user_id=xxxxxxx&order=&section_id=&page=2. You can see the number of views for page two in the columns on the right. This tells you how many times a visitor to your shop clicked as far as the second page.

You can look at all the pages in your report this way, but a simpler way is to have Google make a pie chart for you. Click on the pie chart button to the upper right of the report:


And your information will be displayed graphically. In the following pie chart, it shows that about 40% of the pageviews were of the first page. About 9% clicked on to page 2, about 7% on to page 3 and so on.


Google only includes the top ten pages in this report by default, so if you have more than ten, some views will be included in the "gray" portion of the chart. This portion also includes the views of your pages where someone may have re-ordered your items by listing date or price. I'll have more on how to pull that information out in another post.

Here's a video walkthrough for looking at this report.

Tuesday, February 3, 2009

Tracking Referring Sites by Hour of Day

The Referring Sites report under Traffic Sources in Google Analytics will break down your visits from referring web sites by the day of the week, but by default it does not show you the hour of the day these visits came.

You can look at the Visitor Trending report under the Visitors link and see the overall traffic your site is receiving hour by hour, but this is not broken down by where these visits come from. If you are trying to track traffic from a fast-moving site like Twitter, for example, it might be useful to know what times of day a site is sending you visits. You can find out using Google's Custom Reporting feature. Here's how:

From the left side bar, click the Custom Reporting link.


Click on Create New Custom Report


In the blue Metrics box on the left, open the Site Usage link


Scroll down and select the Visits block. Drag it to the first empty Metrics box in the report tab


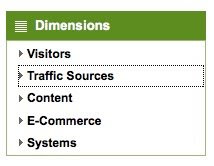
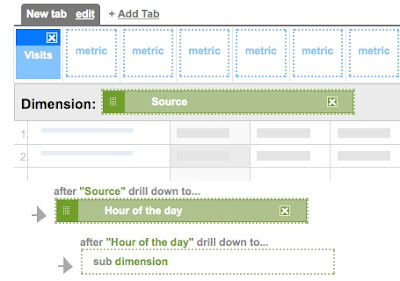
From the green Dimensions box below the Metrics box on the left, select the Traffic Sources link and drag the green Source block to the empty green Dimension box below the Metrics box.


Next, under the Visitors link in the green Dimensions box, drag the Hour of Day block to the first empty Sub Dimension box. When you're done, it should look like this:


Click the Edit link next to the title at the top to give the report a name. Apply.


Click the Create Report button at the bottom of the form.


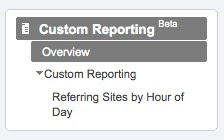
Your report will now show up under your Custom Reporting link.


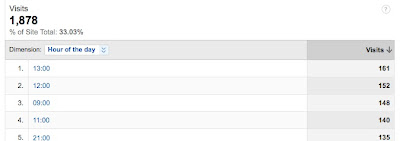
Open the report and you will see a list of referring sites. You can change the date range of the report like any other report. Click on one of the site names in the report to see the hourly report of visits from that site. The hours are in 24-hour time and listed by the busiest first. In the report below you can see that the hour that brought the most traffic from this site is 13:00, or between 1 and 2 pm. Clicking on the hour will show you day-by-day how many visits came in from that site during that hour.


Here's a video walkthrough that shows how to set this all up.

Monday, February 2, 2009

Using GA Goals as an Etsy Front Page Alert

UPDATE: Since Etsy has changed its link structure, these instructions no longer work. They will still show you previous front page visits under the old link system.

Using the goals feature of Google Analytics along with Etsy's referral codes, you can set up a kind of alert to let you know if you start receiving clicks from an appearance on Etsy's front page.

When an items appear on the front page, Etsy adds a little referral code to it. It looks like this:

http://www.etsy.com/listing/xxxxxxxx/item-name?ref=fp_treasury_1

When someone clicks on this link from the front page, this URL shows up in their Google Analytics report. What you can tell Google to do is to watch out for URLs that have this code in them and to let you know if they start showing up. Here's how:

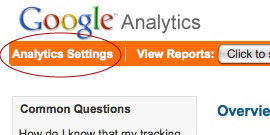
Open your Google Analytics account and go to the Analytics Settings page. The link is in the upper left.


Find your etsy account and click on the Edit link on the right.


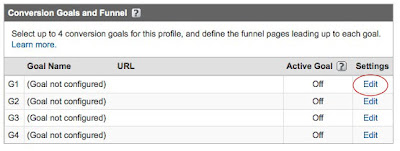
In the middle of the page is a box labeled Goals. Click on the Edit link for the first goal.


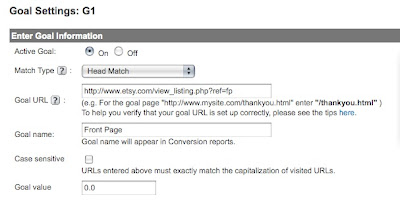
The Goal Settings page will open. Fill it out like this:

Active Goal: On
Match Type: Head Match
Goal URL: http://www.etsy.com/view_listing.php?ref=fp
Goal Name: A name that describes the goal, like Front Page
Case sensitive: Unchecked
Goal value: 0.0


At the bottom of the page, click the Save Changes button.

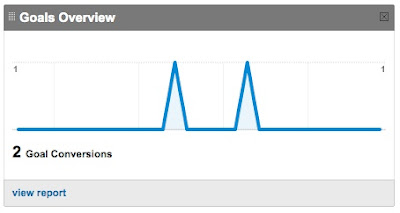
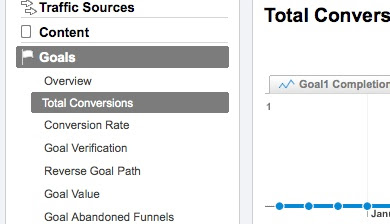
Now go to your reports page for your Etsy shop. You should now see another box on your overview page called Goals Overview


This line will be flat until you receive a visit from the front page, when it will spike for the day on which the item appeared. You can also see this information under the Goals link in the left hand sidebar, under Total Conversions


From this report you can see the day on which your item was on the front page, and by viewing by hour you can see the time of day as well. Also, on your Analytics Settings page, the number of front page hits will appear in the Completed Goals column.

Please Note: This setup will show you any link from the front page, including links from the gift guide scroll at the top left and the recently listed items! If you only want to track your visits in the front page treasury, then use the following Goal URL when setting up your goal:

http://www.etsy.com/view_listing.php?ref=fp_treasury

Sunday, February 1, 2009

Getting more from Etsy Site Search

Once you have set up Site Search in Google Analytics to tell you what search terms people are using to find your items in Etsy's search, it's useful to match the search terms with the actual items they are viewing. Here's how:

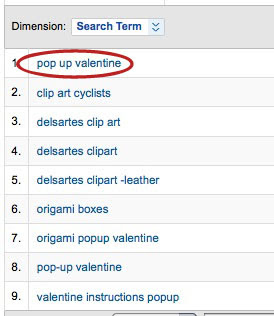
From your Search Terms report in Google, click on one of the terms:


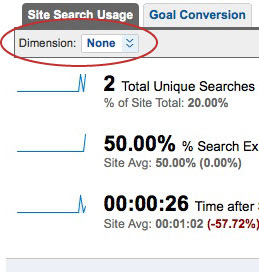
This will open a separate report for this search term. Find the dropdown menu that is called Dimension.


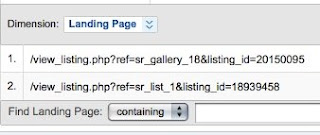
From the Dimension menu, choose Landing Page


This will display the URL of the pages that were found and clicked on using this search term.

Remember! Not only do links to your items show up in Etsy searches, but so does a direct link to your shop. You may see visits directly to your shop in this report, which means that someone searched with these search terms but instead of following a link to your item that showed up in the results, they clicked on the link to your shop page.

Tracking Etsy Searches with Google

With Site Search, you can see the search terms people are entering in Etsy's own search engine that are leading them to your items. You can also easily see the types of searches that people are performing and the percentage of your total visits that come from site searches.

This is a tremendous tool, and it's easy to set up. Here is a screencast video showing how to set up site search, or you can follow the directions below:

  1. Go to your analytics settings page (the link says Analytics Settings and is in the top left corner of your analytics page)
  2. Click the Edit link for your Etsy shop - the link is to the right of the site name
  3. In the Main Website Profile Information header at the top of the page, click the Edit link on the right.
  4. Under Site Search, select "Do track site search"
  5. In the Query Parameter box, type in ga_search_query
  6. Click the "Yes, strip query parameters" option
  7. Under "Do you use catagories..." click Yes.
  8. In the Category Parameter box, type in ga_search_type
  9. Click the "Yes, strip query parameters" option
  10. Click the Save Changes button at the bottom of the page

Now go to your reports for your Etsy shop. Under the Content link on the left sidebar, you'll see a link called Site Search. Click on that link to see the search term reports. You will not see any data right away, but after some time you will see search terms and search types appear here.

Some of the site search reports are more useful than others:

Usage - shows how many of your visits are coming from Etsy searches and the percentage of your total visits that come from searches.

Search Terms - shows the actual terms that people enter to find your items. These are the not all of the searches that your item actually may show up in, but are the searches where someone actually clicked through to one of your items.

Categories - This shows the search types people use to find your items, including when they search from within categories.

Trending - This report breaks down your search visits by hour, day, week or month.

I've updated the list of referral codes to include the Etsy search type codes so you can tell what kinds of searches are leading people to your items. You can find it here.