From the left side bar, click the Custom Reporting link.
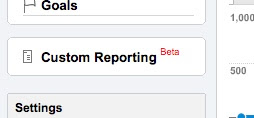
Click on Create New Custom Report

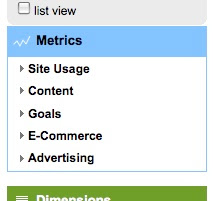
In the blue Metrics box on the left, open the Site Usage link
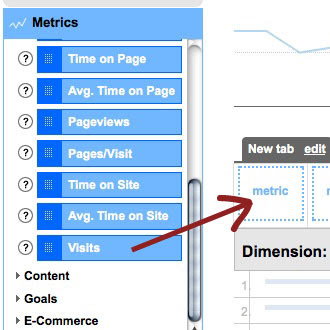
Scroll down and select the Visits block. Drag it to the first empty Metrics box in the report tab
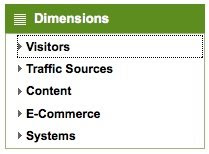
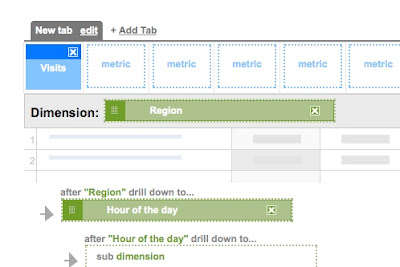
From the green Dimensions box below the Metrics box on the left, select the Visitors link and drag the green Region block to the empty green Dimension box below the Metrics box.
Next, drag the Hour of Day block to the first empty Sub Dimension box. When you're done, it should look like this:
Give the report a title at the top of the page and then click Create Report at the bottom.
You will now find this report under your Custom Reports link in the left-side menu. Bring up the report and you will see a list of regions with the number of visits from each one:

Click on one of the regions and a list of the hours of the visits will come up, ranked by how many visits in each one.

These are listed by your local time - the time you have set in your profile. To find out the visitor's local time, use a time zone converter.
You can also switch the dimension and subdimension in your custom report to create another report to break down your hourly visits by region. Follow the steps above and make your custom report look like this:
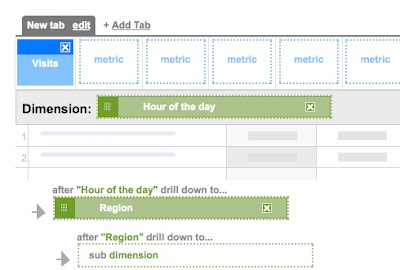
This report will let you look at your traffic broken down by hour of day first, then further group the data by region.

2 comments:
I just discovered Blog Handmade and I'm a regular already. Thanks for all the information! Can't wait to start using it!
gogovivi.etsy.com
Thanks so much for this info! Just linked to you from http://howsweeteritis.blogspot.com/conize
Post a Comment